
The Modern Maturity: Strategically Rebalancing Portfolio Vintage in the Southeast

For the past 10+ years, much of the common multifamily "value-add" investment thesis in the Southeast was centered around investing in 1960s-1970s vintage assets. The strategy was straightforward: find older, well-located workforce housing, renovate, and capture the rental upside by repositioning the asset. However, as we move into 2026, the risk-reward profile for these vintages of assets has shifted. We are seeing a natural evolution in our portfolio, gradually migrating our acquisition focus toward 1980s through early 2000s assets -- what we call the "modern maturity" segment. We see this approach offering a more balanced blend of growth and operational stability.
Here at Ballast Rock Asset Management, we balance on-the-ground acquisition and operational expertise in the Southeast with a data-driven approach to investing. To that end, we recently conducted an internal analysis of the 969 sales of 50+ unit, market-rate multifamily apartment complex sales from 2024-25 that occurred in our core target states (NC, SC, GA, AL, and TN). In this insights article, we use both our internal data and data from Newmark’s 4Q25 Multifamily Report to understand what is happening in the multifamily capital markets.
Though we continue to track origination of assets across all vintages, the data supports a subtle origination strategy shift as a disciplined adjustment to a more complex economic environment of higher cost and slower forecast rent growth.
Re-Evaluating the "Expected Yield" vs. "Realized Return"
The CoStar data shows that 1970/80s-era properties still command the highest yields, trading at 6.3% to 6.5% cap rates. Historically, this premium was the primary draw. However, the current cycle has introduced new pressures that eat into that spread.
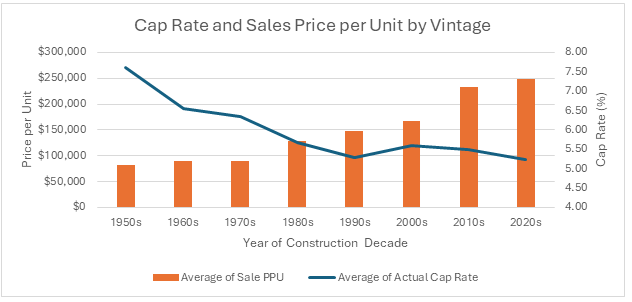
Sources: Data: CoStar, Graph: BRAM
Newmark’s 4Q25 report shows the trickle-down impact of new supply on lower-tiered assets, particularly in the Southeast. With nearly 40% of Class C SE assets having to offer concessions to attract tenants, paired with the rising operating costs like insurance, parts, and labor, the perceived yield on older product often fails to materialize as actual cash flow. In contrast, 1990s and early 2000s assets, which are trading between 5.2% and 5.5% in the CoStar data, tend to require less-intensive capital expenditure and maintain more consistent occupancy, leading to a more predictable realized return.
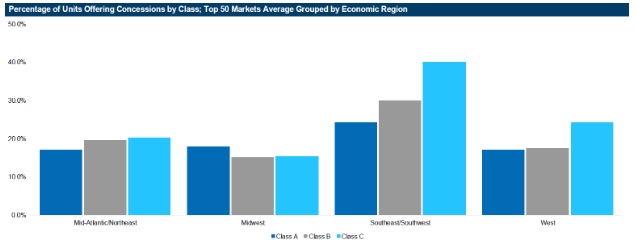
Sources: Newmark Research, RealPage
Bridging the Valuation Gap: Property Classes and the Physical Obsolescence Cliff
There is a clear structural divide in the CoStar Asset Class data, where Class A assets trade at a 155% premium to their Class C counterparts. Moving into this slightly newer bracket allows us to bypass what we call the "physical obsolescence cliff." By targeting Class B, 1980s-2000s vintage, we are acquiring assets that already feature more modern floor plans (larger bathrooms, walk-in closets, and better wiring), which are more resilient in a competitive leasing market.
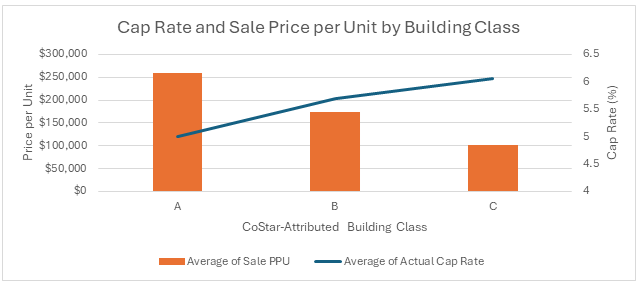
Sources: Data: CoStar, Graph: BRAM
While CoStar data shows Class C cap rates at 6.06%, we believe the 5.68% cap rate found in Class B represents a superior risk-adjusted return. In the current environment, the 40-basis-point spread offered by Class C is often illusory, as it is frequently consumed by the capital expenditures and regulatory hurdles that Newmark identifies as "Regulatory Headwinds" facing older Southeast stock. Furthermore, as shown in the YoY effective rent change, Class C often lags B in rent gains, while declining first and further during downturns. Moving into Class B allows us to capture the durability of a more resilient tenant base while maintaining the institutional liquidity that comes with higher-quality assets.
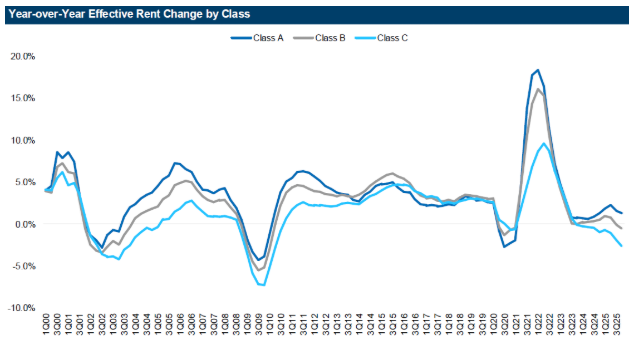
Sources: Newmark Research, RealPage
The Secondary Market Surge: Efficiency over Conventional Liquidity
While the industry narrative often fixates on the sheer volume of Primary markets, a closer look at the CoStar data reveals a compelling "Secondary Market Paradox." Despite having fewer total transactions, Secondary markets are currently outperforming Primary metros in both pricing stability and yield compression. According to CoStar data, Secondary markets currently command the tightest yield in the region, with an average 5.52% cap rate, undercutting Primary markets (5.64%). This suggests that "Tier 2" cities in the Southeast are no longer seen as risky alternatives, but as high-conviction safe havens with strong growth prospects where investors are willing to pay a premium for stability and growth prospects that accompany many of these cities.
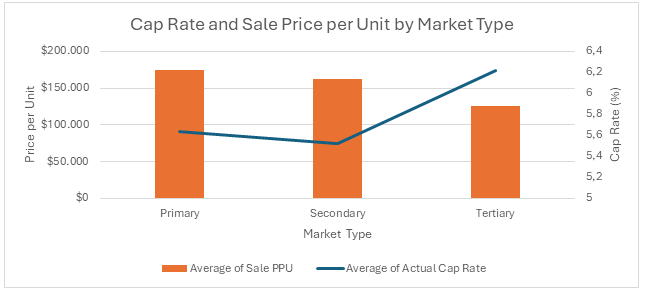
Sources: Data: CoStar, Graph: BRAM
Conclusion: A Disciplined Evolution of Acquisition Strategy
The shift from 1960s-1970s vintage assets to 1980s-2000s vintage assets reflects the evolution of the value-add strategy and a maturing market. The headwinds of insurance, concessions, and regulation require a more defensive posture. By utilizing a data-first approach to identify where asset yield and quality are optimized, we are positioning our portfolio acquisition strategy to capture the Southeast’s continued growth while insulating ourselves from the operational friction increasingly inherent in older vintage assets. We believe that an acquisition strategy that looks less at chasing high-risk premiums and focuses instead on capturing durable, high-quality, reliable returns is the best way to protect our investors and position our funds for success in the current environment.
* Ballast Rock Asset Management (“BRAM”), Ballast Rock Private Wealth (“BRPW”), and Ballast Rock Capital (“BRC”) are operating entities of Ballast Rock Holdings (“BRH"), an integrated investment management company. Ballast Rock Asset Management is a non-registered entity. Sunbelt Properties is a wholly owned subsidiary of BRAM. BRPW is a registered investment advisor. BRC is a registered Broker dealer and a MEMBER of FINRA / SIPC. BRC’s registered head office is 460 King Street, Suite 200, Charleston, SC, 29403. Tel: 800-204-2513. To check background information about BRC and its representatives, visit FINRA’s BrokerCheck. Please see important disclosure information in our Form CRS