
Census Data Proves Positive Outlook for Southeast Multifamily Market

2020 Census data has now been released and we wanted to highlight relevant data about the continued demographic growth in the Southeast. In this article, we will review several key statistics and how they relate to the Ballast Rock Real Estate strategies.

The populations of Texas, Florida, Georgia, North Carolina, South Carolina, and Tennessee (all “Sunbelt” states) all grew faster over the last 10-years than the United States as a whole (7.40%).
Seven out of nine South and Southeastern states had a positive 10-year total net migration confirming strong overall population growth in both submarkets.
Four of the most populous states: California, New Jersey, New York, and Illinois all saw negative, or near-zero, total net migration.
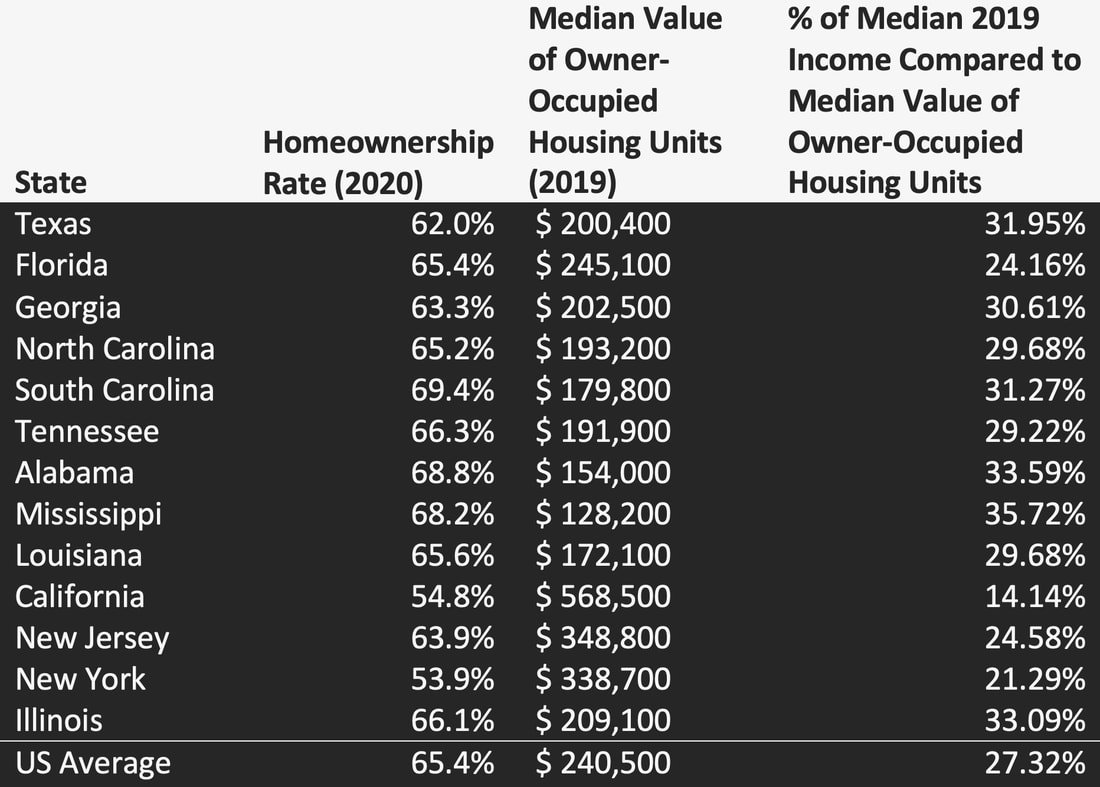
Texas, Florida, Georgia, North Carolina, Tennessee, and Louisiana all have below average, or near below average, homeownership rates, signaling a continuous need for affordable rental alternatives.
Ballast Rock’s average price per door as of 10/4/21 for acquisitions in Sunbelt 1 and Sunbelt 2 has been $59,630 per apartment. This low entry price enables our continued focus on providing safe, clean and affordable homes to working families in our communities.
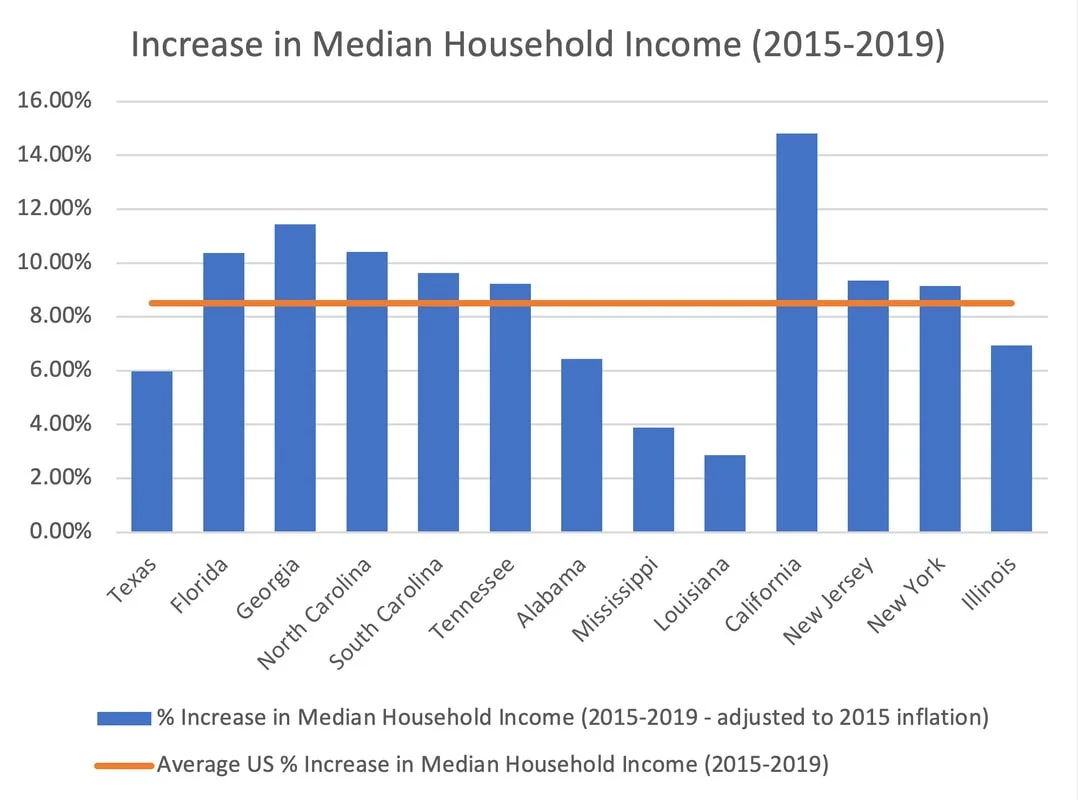
Median income in Florida, Georgia, North Carolina, South Carolina, and Tennessee between 2015 and 2019 grew at a faster pace than the average American household (8.51%), showcasing the Sunbelt’s robust income growth. As rental pricing generally tracks real income growth, we are able to continue to organically raise rents in-line with income growth, without changing a residents proportion of income that goes to pay for rent.
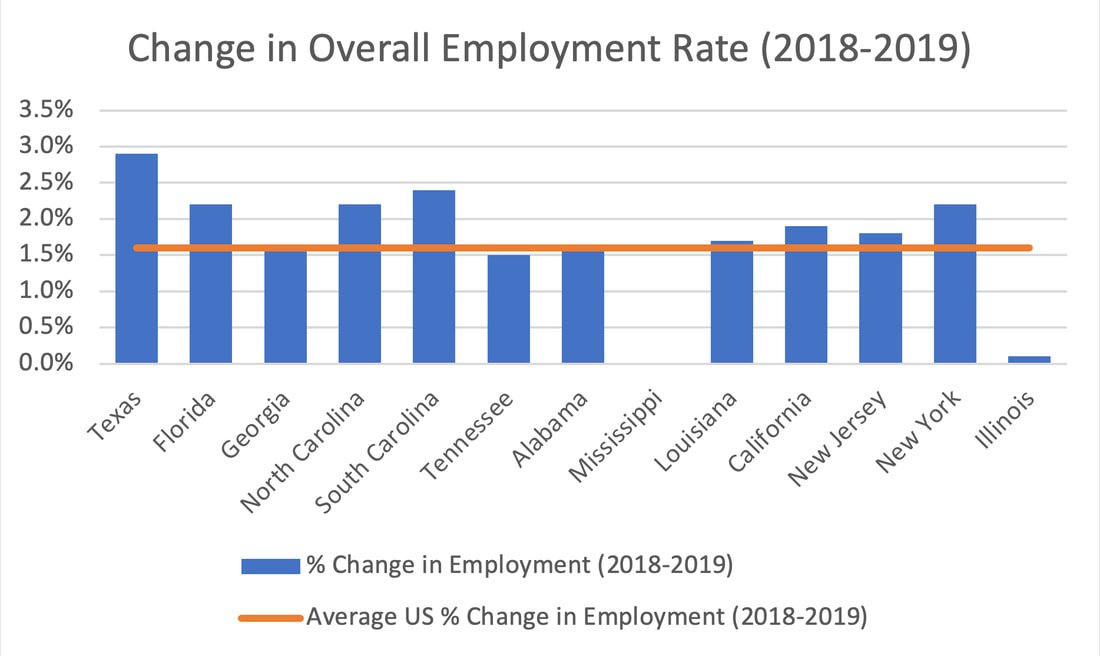
*Mississippi does not provide data regarding change in overall employment
The growth in the overall employment rate between 2018 and 2019 in all South and Southeastern states, besides Tennessee, grew at a faster, or similar, rate compared to the rest of the United States (1.6%).
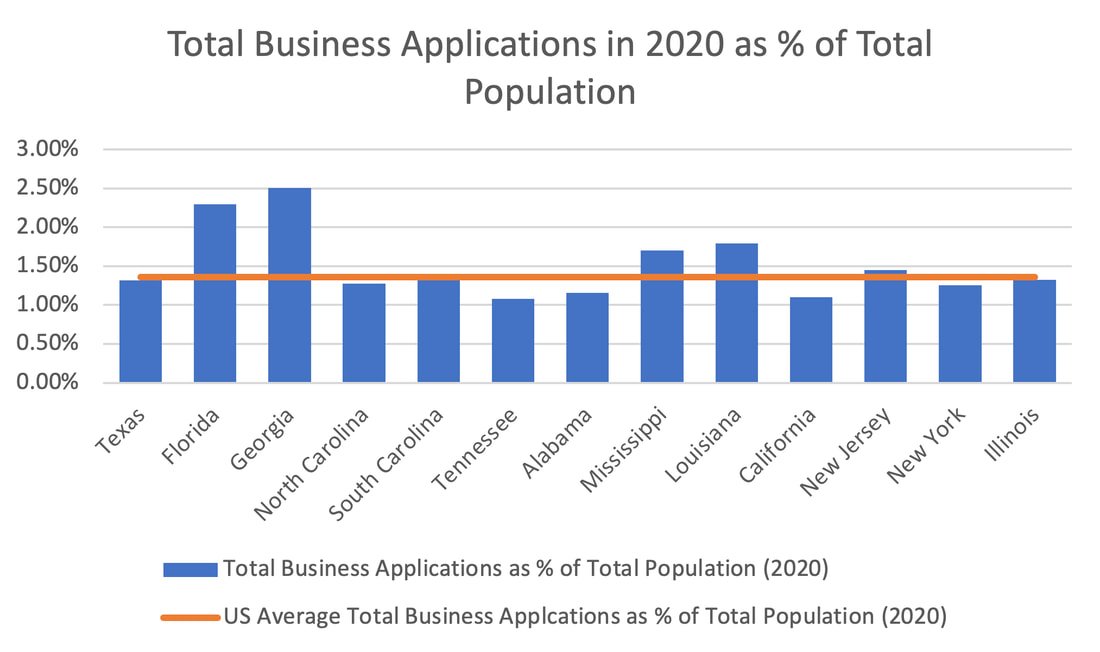
Despite the economic challenges brought on by the Covid pandemic, Florida, Georgia, South Carolina, Mississippi, and Louisiana all had higher rates of business applications as a percentage of population compared to the U.S. average (1.36%) during 2020.
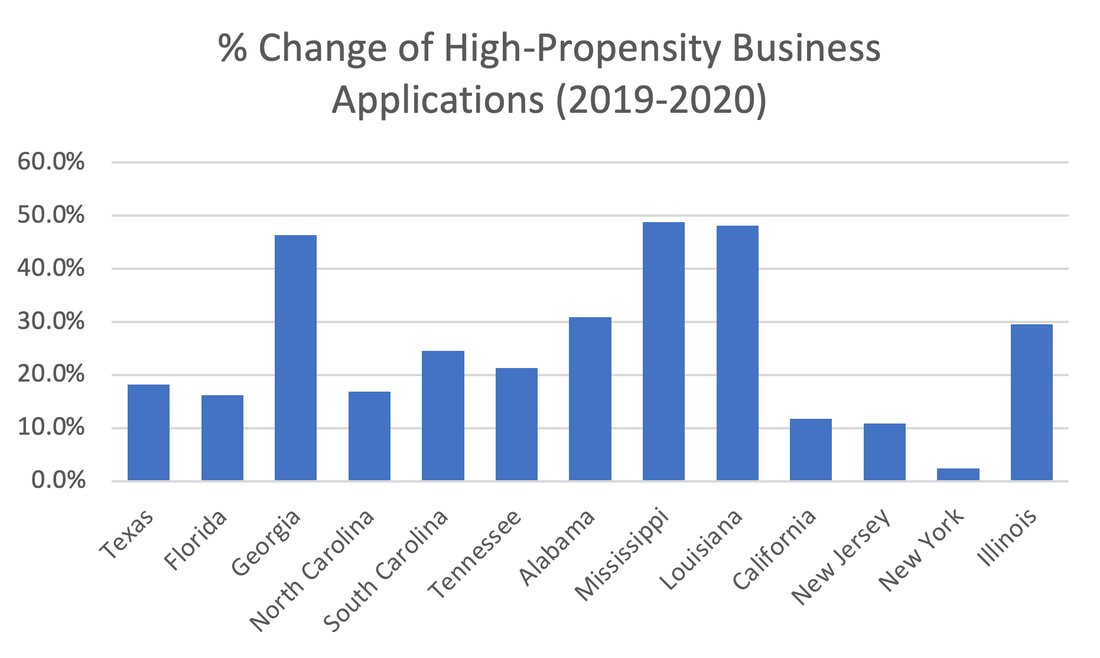
Georgia, Alabama, Mississippi, and Louisiana were the four states with the largest increase in high-propensity business applications* between 2019 and 2020 in the United States.
High-propensity applications are applications from businesses that have a strong likelihood of having employees on their payroll. The United States Census makes this determination based on several factors from the application, such as whether the application comes from a corporate entity, indicates its plans to hire employees, or is from a certain industry that is associated with “likely employment” (e.g., manufacturing, retail stores, or restaurants). (The Startup Surge?)
Conclusion:
As the census has shown, South and Southeastern Sunbelt states have had strong demographic growth over the past ten years. In general, these states sharply outpace the United States’ averages in population, business, and income growth, which are vital to creating a growing rental market and obtaining strong returns on rental properties. As the South and Southeastern Sunbelt states continue to be a stable geographic region with steady growth, Ballast Rock is poised to continue to harness this growth by acquiring, in-house-managing, and selling real estate while providing our investors with diversified, consistent passive income on a tax shielded basis, with a positive social impact.
-
Bureau, U.S. Census. "U.S. Adult Population Grew Faster Than Nation's Total Population From 2010 to 2020." The United States Census Bureau. September 08, 2021. Accessed October 01, 2021. https://www.census.gov/library/stories/2021/08/united-states-adult-population-grew-faster-than-nations-total-population-from-2010-to-2020.html.
Bureau, U.S. Census. "ALABAMA: 2020 Census." The United States Census Bureau. August 24, 2021. Accessed October 01, 2021. https://www.census.gov/library/stories/state-by-state/alabama-population-change-between-census-decade.html.
Bureau, U.S. Census. "U.S. Housing Vacancy Rate Declined in Past Decade." The United States Census Bureau. September 08, 2021. Accessed October 01, 2021. https://www.census.gov/library/stories/2021/08/united-states-housing-vacancy-rate-declined-in-past-decade.html#:~:text=The decennial census collects information,was in 2000 (9.0%).
Bureau, US Census. "2020 Census: Percent Change in Resident Population: 2010 to 2020." The United States Census Bureau. April 30, 2021. Accessed October 01, 2021. https://www.census.gov/library/visualizations/2021/dec/2020-percent-change-map.html.
Bureau, US Census. "Annual Business Applications by State and County." The United States Census Bureau. June 30, 2021. Accessed October 01, 2021. https://www.census.gov/library/visualizations/interactive/bfs-annual-state-county.html.
Census Business Builder: Small Business Edition - 3.4. Accessed October 01, 2021. https://cbb.census.gov/sbe/#view=map&industries=45111&clusterName=Sporting Goods Stores&geoType=state&dataVariable=64&dashboardVars=15-1-17-33¢erX=-10679160¢erY=4135304&level=5&dataVariable1=65&geoId=12&dynHeader=My Region.
Explore Census Data. Accessed October 01, 2021. https://data.census.gov/cedsci/table?t=Populations and People&g=0400000US01,12,13,22,28,37,45,47,48&tid=DECENNIALPL2020.P1.
Explore Census Data. Accessed October 01, 2021. https://data.census.gov/cedsci/table?q=house price&t=Housing&g=0400000US01,12,13,22,28,37,45,47,48&y=2019&tid=ACSDT1Y2019.B25077.
Explore Census Data. Accessed October 01, 2021. https://data.census.gov/cedsci/table?q=median income&t=Earnings (Individuals)&g=0400000US01,12,13,22,28,37,45,47,48&y=2015&tid=ACSST1Y2015.S1901.
Explore Census Data. Accessed October 01, 2021. https://data.census.gov/cedsci/table?q=median income&g=0100000US_0400000US01,12,13,22,28,37,45,47,48&tid=ACSST1Y2019.S1901.
"QuickFacts United States." United States Census Bureau. Accessed October 1, 2021. https://www.census.gov/quickfacts/fact/table/US/HSG860219.
Staff, US Inflation Calculator. "Inflation Calculator: Find US Dollar's Value from 1913-2021." US Inflation Calculator |. September 14, 2021. Accessed October 01, 2021. https://www.usinflationcalculator.com/.
"The Startup Surge? Unpacking 2020 Trends in Business Formation." Economic Innovation Group. July 15, 2021. Accessed October 01, 2021. https://eig.org/news/the-startup-surge-business-formation-trends-in-2020.
"US Data." PRB. Accessed October 01, 2021. https://www.prb.org/usdata/indicator/migration/snapshot/.